ecGraph3D - Demo9
- 10,000 bars, axis style, aspect, position, orientation, and color table.
- Scroll down below the screenshot image to see the VB code that was used to
generate the graph.
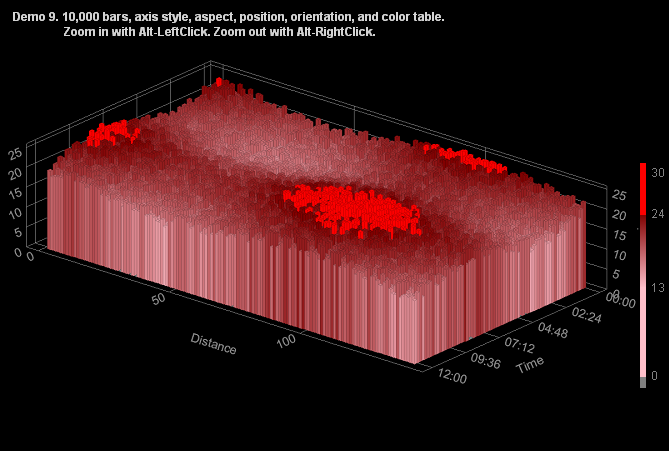
The VB code used to generate the above graph...
Public Sub Demo9(ecGraph3D1 As ecGraph3D)
'10,000 bars, axis style, aspect, position, orientation, and color table
Const nX = 70, nY = 140
Dim i As Integer, j As Integer, x As Single, y As Single, z As Single, Title$
Dim zData(nX, nY) As Single, BarTooltips$(nX, nY) 'define a matrix to hold the z-values
With ecGraph3D1
Call .Reset 'always start with "Reset"
Call .SetBackground(vbBlack)
.RibbonsAlongX = True
.ShowHourGlassWhenDrawing = True
.ScrollMode = 4 'show only a bounding box when scrolling, as this graph takes a while to draw
'Specify the position and viewing angle, and aspect ratios..
Call .SetGraphShapeFactors(1, 1.8, 0.7)
Call .SetViewDetails(248, 40, 0, 0, 88)
Title$ = "Demo 9. 10,000 bars, axis style, aspect, position, orientation, and color table." + vbCrLf + _
" Zoom in with Alt-LeftClick. Zoom out with Alt-RightClick."
Call .AddText(Title$, 2, 2, ecLightGray, "bold")
'create a custom color table..
Call .SetzColorTableStyle(95, 40, 1, 50, vbBlack, "", ecGray)
Call .ClearColorBands
z = 0: Call .AddColorBand(z, ecGray, ecGray, Trim(Str(z)))
z = 13: Call .AddColorBand(z, ecPink, ecPink, Trim(Str(z)))
z = 24: Call .AddColorBand(z, ecPink, ecMaroon, Trim(Str(z)))
z = 30: Call .AddColorBand(z, vbRed, vbRed, Trim(Str(z)))
'Create array of z-values and custom tooltips to plot
For i = 1 To nX
x = 8 * (i - nX / 2) / nX
For j = 1 To nY
y = 8 * (j - nY / 2) / nY
z = 18 + 2 * (Sin(x) + Sin(y) + 2 * Rnd)
If Rnd < 0.05 Then z = 0
zData(i, j) = z
BarTooltips$(i, j) = "Time=" + Format(x, "hh:mm") + ", Distance=" + Format(j, "0") + ", Pressure=" + Format(z, "0.0")
Next j
Next i
'Customise the axes
Call .xAxisStyle(ecGray, "Time", "0,0.1,0.2,0.3,0.4,0.5", ecGray, ecGray, "10", "", "hh:mm")
Call .yAxisStyle(ecGray, "Distance", "", ecGray, ecGray, "", "")
'Add the data array
Call .AddDataArray(nX, 0, 0.5, nY, 1, nY, zData)
'add the custom tooltips array
Call .AddTooltips(BarTooltips$)
Call .Refresh 'always end with "Refresh"
End With
End Sub
Contents
(ecGraph3D.ocx) Variables
Events Properties Functions Subs
Copyright © 2008, Encore Consulting Pty Ltd