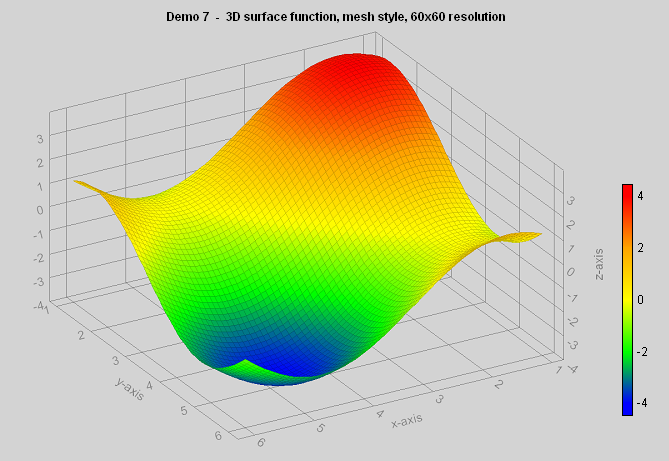
ecGraph3D - Demo7
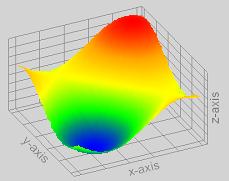
- 3D surface function, mesh style, 60x60 resolution.
- Scroll down below the screenshot image to see the VB code that was used to
generate the graph.
The VB code used to generate the above graph...
Public Sub Demo7(ecGraph3D1 As ecGraph3D)
'3D surface function, mesh style, 60x60 resolution.
Dim z As Integer
With ecGraph3D1
Call .Reset 'always start with "Reset"
Call .AddText("Demo 7 - 3D surface function, mesh style, 60x60 resolution", 50, 2, , "bold", 1)
.PlotStyle = 3 'PlotStyle: 0=waterfall, 1=slabs, 2=ribbons, 3=mesh, 4=columns
.RenderStyle = 1 'RenderStyle: 0=Gradient, 1=solid, 2=wireframe, 3=axes only
.Skirt = 0 'Skirt: 0=none, 1=wire frame, 2=solid
Call .ClearColorBands
z = -4: Call .AddColorBand(z, vbBlue, vbBlue, Trim(Str(z)))
z = -2: Call .AddColorBand(z, vbBlue, vbGreen, Trim(Str(z)))
z = 0: Call .AddColorBand(z, vbGreen, vbYellow, Trim(Str(z)))
z = 2: Call .AddColorBand(z, vbYellow, ecOrange, Trim(Str(z)))
z = 4: Call .AddColorBand(z, ecOrange, vbRed, Trim(Str(z)))
Call .SetzColorTableStyle(93, 40, 1.4, 50, vbBlack, "", vbBlack)
'add a math function: z = f(x,y) with x and y range and resolution..
Call .AddFunction("2*(sin(x)+sin(y))", 60, 1, 6, 60, 1, 6, -4)
Call .Refresh 'always end with "Refresh"
End With
End Sub
Contents
(ecGraph3D.ocx) Variables
Events Properties Functions Subs
Copyright © 2008, Encore Consulting Pty Ltd