ecGraph3D - Demo5
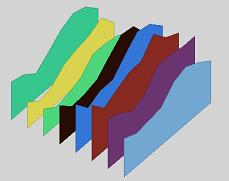
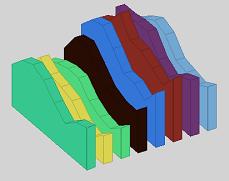
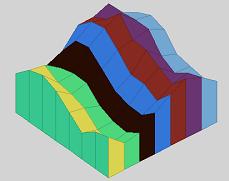
- Parallel data sets, separate color per set, waterfall view.
- Scroll down below the screenshot image to see the VB code that was used to
generate the graph.
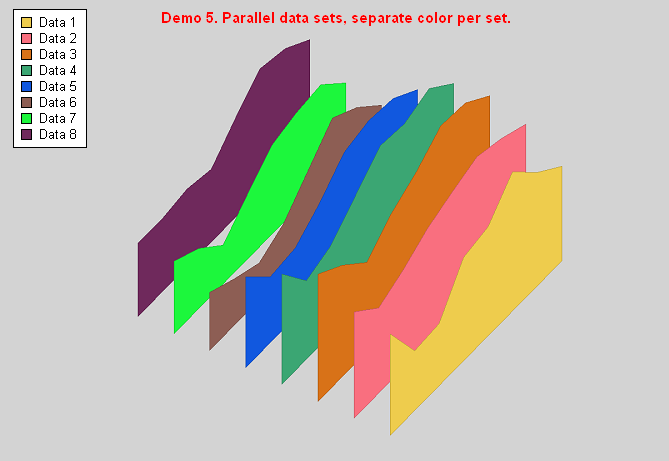
The VB code used to generate the above graph...
Public Sub
Demo5(ecGraph3D1 As ecGraph3D)
'Parallel data sets, separate color per
set.
Dim zColors(8, 8) As
Long, i As Integer, j As Integer, k As Long
With
ecGraph3D1
Call .Reset
'always start with "Reset"
.ShowAxes = False
Call .AddText("Demo 5. Parallel data
sets, separate color per set.", 50, 2, vbRed, "Arial|bold|11", 1)
Call .LegendTableStyle(2, 2, "Arial|10")
For i = 1 To 8
k = Rnd *
vbWhite
Call
.AddLegendEntry("Data" + Str(i), k, vbBlack, 1)
For j = 1
To 8
zColors(i, j) = k
Next j
Next i
'add a math function: z = f(x,y) with x and y range and
resolution..
Call
.AddFunction("3+sin(x)+sin(y)+rnd(1)", 8, 0, 6, 8, 0,
6)
Call
.AddBarColors(zColors)
.BarWidthX = 0.5: .BarWidthY
= 0.8
Call .Refresh 'always end with
"Refresh"
End With
End Sub
Contents
(ecGraph3D.ocx) Variables
Events Properties Functions Subs
Copyright © 2008, Encore Consulting Pty Ltd