ecGraph3D - Demo4
- Some colors by z-color table, some random colors.
- Scroll down below the screenshot image to see the VB code that was used to
generate the graph.
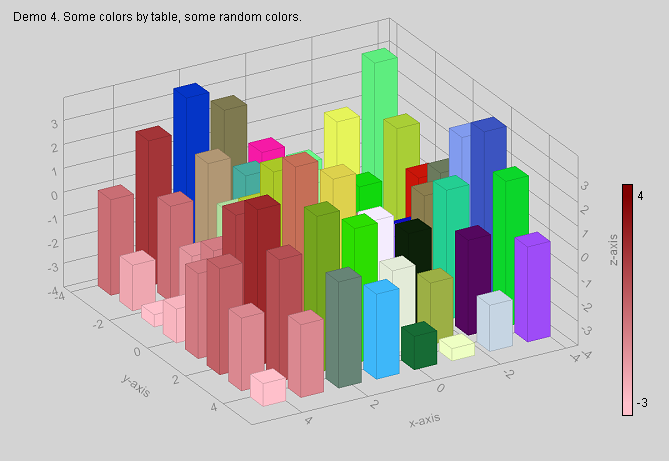
The VB code used to generate the above graph...
Public Sub Demo4(ecGraph3D1 As ecGraph3D)
'Some colors by z-color table, some random colors.
Const Rows = 8, Cols = 8
Dim BarTooltips$(Rows, Cols), zColors(Rows, Cols) As Long, i As Integer, j As Integer
With ecGraph3D1
Call .Reset 'always start with "Reset"
Call .AddText("Demo 4. Some colors by z-color table, some random colors.", 2, 2)
'Here is a quick way to set a simple color band with just two colors..
Call .SimpleColorBand(-3, 4, ecPink, ecMaroon)
'add a math function: z = f(x,y) with x and y range and resolution..
Call .AddFunction("2*(sin(x)+sin(y))", Rows, -4, 4, Cols, -4, 4, -4)
For i = 1 To Rows
For j = 1 To Cols
'We have chosen "999" here as the value to force the use of z-colors according to z-value.
'(You can choose any number). Any array element given zColors(i,j)=999 will use the z-color
'table defined above with ".SimpleColorBand", otherwise it will use the specific value of
'zColors(i,j) as the color for that bar element.
If i > 6 Then
zColors(i, j) = 999 'rows 7 & 8 use the z-color table defined by ".SimpleColorBand"
BarTooltips$(i, j) = "" 'no tooltip for these elements
Else 'other rows are given a random color to use for each bar
zColors(i, j) = Rnd * vbWhite
BarTooltips$(i, j) = "Color =" + Str(zColors(i, j)) 'custom tooltips
End If
Next j
Next i
.BarWidthX = 0.6: .BarWidthY = 0.6
Call .AddTooltips(BarTooltips$)
Call .AddBarColors(zColors, 999)
Call .Refresh 'always end with "Refresh"
End With
End Sub
Contents
(ecGraph3D.ocx) Variables
Events Properties Functions Subs
Copyright © 2008, Encore Consulting Pty Ltd