|
|
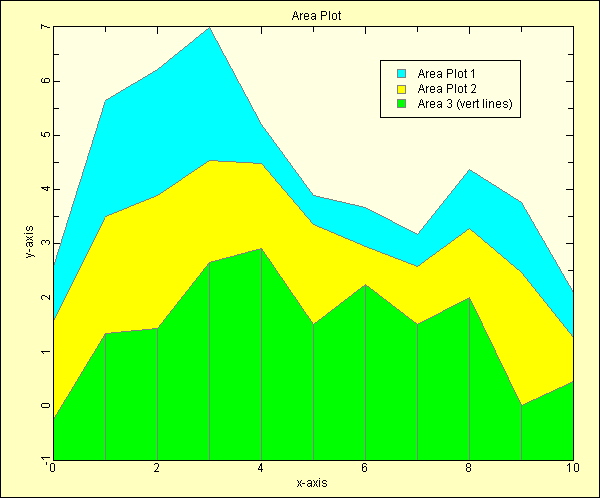
ecGraph Demo16. Area Plot
- Area Plot
- Showing three data series of random points
The VB code used to generate the above graph...
Public Sub Demo16(ecGraph1 As ecGraph)
'Area Plot
Dim i As Integer, X1(10) As Double, Y1(10)
As Double,
Y2(10) As Double, Y3(10) As
Double
'Prepare 3 data sets. Y3=top,
Y2=middle, Y1=lower
For i = 0 To 10
X1(i) = i
Y1(i) = 1 + i - (i * i) / 10 - 2 *
Rnd
Y2(i) = Y1(i) + 0.5 + 2 * Rnd
Y3(i) = Y2(i) + 0.5 + 2 * Rnd
Next i
With ecGraph1
Call .Reset
'Always call "Reset" first to clear the
page
'Start a new graph
on the page..
Call .NewGraph("Area
Plot")
'Start a new data set on the graph, plot Top set
first..
Call .NewDataSet("Area
Plot 1")
Call .SymbolStyle(0, 2, vbCyan, ecGray) 'no symbol, fill color is used to fill the area
plot
Call .DataLine(ecGray, 1, 4) 'Style: 4=area plot, gray border
For i = 0
To 10
Call .AddDataPoint(X1(i), Y3(i))
Next i
'Second data set for this graph, plot Middle
set..
Call .NewDataSet("Area
Plot 2")
Call .SymbolStyle(0, 2, vbYellow, ecGray)
'no symbol
Call
.DataLine(ecGray, 1, 4) 'Style: 4=area plot,
gray border
For i = 0 To 10
Call .AddDataPoint(X1(i), Y2(i))
Next i
'Third data set for this graph, plot Lower set
last..
Call .NewDataSet("Area 3
(vert lines)")
Call .SymbolStyle(0, 2, vbGreen, ecGray) 'no symbol
Call .DataLine(ecGray, 1, 5) 'Style: 5=area plot with vertical lines, gray
border
For i = 0 To 10
Call .AddDataPoint(X1(i), Y1(i))
Next i
Call .Refresh 'Always
end with "Refresh"
End With
End Sub
Copyright © 2007,
Encore Consulting Pty Ltd.
www.encoreconsulting.com.au
|