ecGraph3D - Demo2
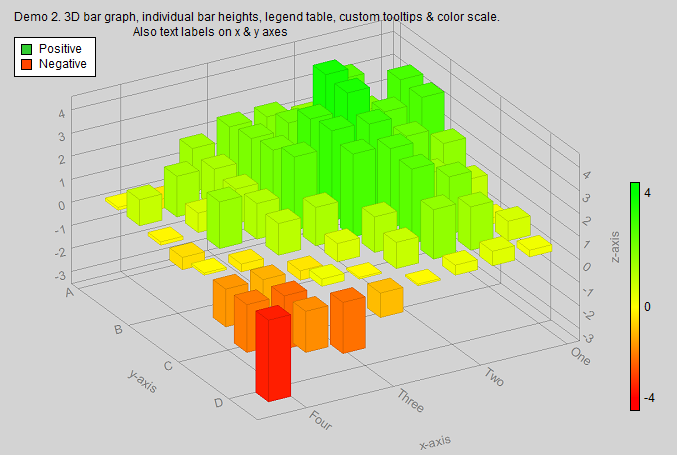
- 3D bar graph, individual bar heights, legend table, custom tooltips &
color scale.
- Scroll down below the screenshot image to see the VB code that was used to
generate the graph.
The VB code used to generate the above graph...
Public Sub
Demo2(ecGraph3D1 As ecGraph3D)
'3D bar graph, individual bar heights,
legend table, custom tooltips & color scale.
Const nX = 8, nY = 8
Dim i As Integer, j As Integer, x As Single, y As Single, z As Single
Dim
zData(nX, nY) As Single, BarTooltips$(nX, nY) 'define a matrix to hold the z-values
With ecGraph3D1
Call .Reset 'always start with "Reset"
Call .AddText("Demo 2. 3D bar graph, individual bar heights, legend table,
custom tooltips & color scale.", 2, 2)
'Create a custom z-color table
to color bars according to their height..
Call .ClearColorBands
'Color bands must be allocated
in order from lowest z-value to
highest
Call
.AddColorBand(-4, vbRed, vbRed, "-4") 'The 1st color band (red) goes from z=-infinity to
z=-4
Call
.AddColorBand(0, vbRed, vbYellow, "0") 'The 2nd color band (red to yellow) goes from z=-4 to
0
Call
.AddColorBand(5, vbYellow, vbGreen, "4") 'The 3rd color band (yellow to green) goes from z=0 to
4
'Add a legend table with two legend entries..
Call
.AddLegendEntry("Positive", ecLimeGreen)
Call
.AddLegendEntry("Negative", ecOrangeRed)
'Reduce bar widths to 60% of full column width..
.BarWidthX = 0.6: .BarWidthY = 0.6
'Create an array of z-values to plot, and allocate a custom
tooltip to each array element
For i = 1 To nX
x = i / 2
For j = 1
To nY
y = j / 2
z = 2 * (Sin(x) + Sin(y) +
Rnd - 0.5)
zData(i, j) = z
BarTooltips$(i, j) = "x=" + Format(x, "0.00") + ", y=" + Format(y, "0.00") +
", z=" + Format(z, "0.00")
Next j
Next i
'Add the data array (do this only once for each graph)
Call .AddDataArray(nX,
1, 4, nY, 1, 4, zData)
'add the custom tooltips array
Call
.AddTooltips(BarTooltips$)
'Text labels instead of values
'Values$ holds a comma-separated list of values at which labels are to be placed, each value followed by text to print at that value in {braces}.
Call.xAxisStyle(ecGray, "x-axis",
"1{One},2{Two},3{Three},4{Four}", ecGray,ecGray)
Call.yAxisStyle(ecGray, "y-axis",
"1{A},2{B},3{C},4{D}", ecGray,ecGray)
Call .Refresh 'always end with "Refresh"
End With
End Sub
Contents
(ecGraph3D.ocx) Variables
Events Properties Functions Subs
Copyright © 2012, Encore Consulting Pty Ltd