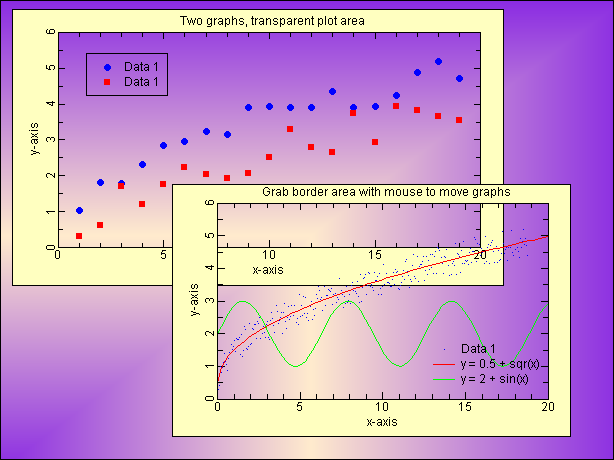
EcGraph Demo9. Two graphs, transparent plot area.
- Two graphs, transparent plot area.
- Scroll down below the screenshot image to see the VB code that was used to generate the graph.
The VB code used to generate the above graph...
Public Sub Demo9(EcGraph1 As EcGraph)
'Two graphs, transparent plot area
Dim MathFunc$, S$, i, Color As Long, X As Double, Y As Double
Dim Symbol As Integer, SymbolSize As Single, Line As Integer, Legend$
With EcGraph1
Call .Reset 'Always call "Reset" first
Call .PageColors(ecDarkBlueViolet, ecBlanchedAlmond, 200, , -5)
'Start the first graph...
Call .NewGraph("Two graphs, transparent plot area")
Call .GraphPosition(2, 2, 80, 60)
Call .BorderStyle(, , , , True, , 12, 6, 6, 10)
Call .PlotAreaColors(, , , , , True)
Call .LegendTableStyle(, , 15, 16, , , , , , , , True)
'First data set for this graph
Call .NewDataSet("Data 1")
For i = 1 To 19
X = i: Y = Sqr(i) + Rnd
Call .AddDataPoint(X, Y)
Next i
'Second data set for this graph
Call .NewDataSet("Data 1")
For i = 1 To 19
X = i: Y = Sqr(i) - Rnd
Call .AddDataPoint(X, Y)
Next i
'Second graph...
Call .NewGraph("Grab border area with mouse to move graphs")
Call .GraphPosition(28, 40, 65, 55)
Call .BorderStyle(, , , , True, , 12, 5, 6, 10)
Call .LegendTableStyle(, , 63, 60, , 0, , , , , , True)
Call .PlotAreaColors(, , , , , True)
Call .NewDataSet("Data 1")
Call .SymbolStyle(2)
For i = 1 To 300
X = i / 16: Y = Sqr(X) + Rnd
Call .AddDataPoint(X, Y)
Next i
'Add a math function..
MathFunc$ = "0.5 + sqr(x)"
Call .NewDataSet("y = " + MathFunc$)
Call .AddMathFunc(MathFunc$, 0, 20)
'Add a math function..
MathFunc$ = "2 + sin(x)"
Call .NewDataSet("y = " + MathFunc$)
Call .AddMathFunc(MathFunc$, 0, 20)
Call .Refresh 'Always end with "Refresh"
End With
End Sub