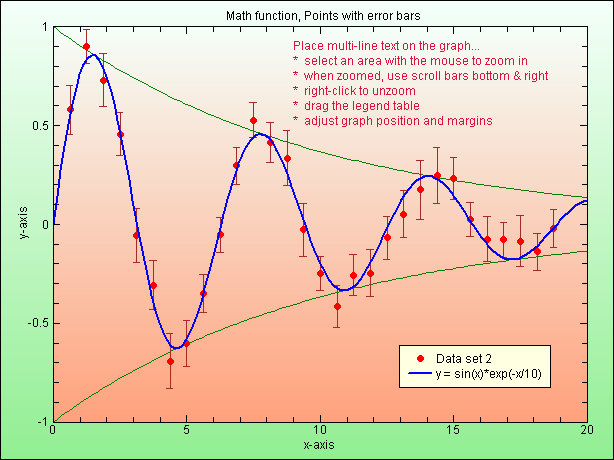
EcGraph Demo7. Math function, Points with error bars.
- Math function, Points with error bars.
- Scroll down below the screenshot image to see the VB code that was used to generate the graph.
The VB code used to generate the above graph...
Public Sub Demo7(EcGraph1 As EcGraph)
'Math function, Points with error bars
Dim MathFunc$, i, Color As Long, X As Double, Y As Double
Dim Symbol As Integer, SymbolSize As Single, Line As Integer, Legend$
With EcGraph1
Call .Reset 'Always call "Reset" first
'Start the graph...
Call .NewGraph("Math function, Points with error bars") ', 0, 20, -1, 1)
Call .AxisScaleStyle(0, 20, 4, 5, 1)
Call .PlotAreaColors(ecLightSalmon, ecMintCream)
Call .BorderStyle(ecLightGreen, ecMintCream)
Call .LegendTableStyle(, , 65, 75)
Call .SelectYaxis 'select the y-axis.
Call .AxisScaleStyle(-1, 1, 4, 5, 1)
Call .AxisLabelStyle("", , -1, 0)
'Add upper boundary line as a math function..
MathFunc$ = "exp(-x/10)"
Call .NewDataSet("upper boundary line", False)
Call .AddMathFunc(MathFunc$, 0, 20)
Call .DataLine(ecGreen)
'Add lower boundary line as a math function..
MathFunc$ = "-exp(-x/10)"
Call .NewDataSet("lower boundary line", False)
Call .AddMathFunc(MathFunc$, 0, 20)
Call .DataLine(ecGreen)
'Add some data points..
Call .NewDataSet("Data set 2")
Call .SymbolStyle(3, 1.6, ecDarkRed, ecBrown)
Call .DataLine(, , 0)
For i = 1 To 30
X = i / 1.6: Y = Sin(X) * Exp(-X / 10) + (Rnd - 0.5) / 5
Call .AddDataPoint(X, Y, 0.08 * (1 + Rnd)) '(x,y,error bar height)
Next i
'Add a math function..
MathFunc$ = "sin(x)*exp(-x/10)"
Call .NewDataSet("y = " + MathFunc$, True)
Call .AddMathFunc(MathFunc$, 0, 20)
Call .DataLine(ecDarkBlue, 2)
'Add text..
Call .NewDataSet("Text")
Call .AddText("Place multi-line text on the graph..." + vbCrLf _
+ "* select an area with the mouse to zoom in" + vbCrLf _
+ "* when zoomed, use scroll bars bottom & right" + vbCrLf _
+ "* right-click to unzoom" + vbCrLf _
+ "* drag the legend table" + vbCrLf _
+ "* adjust graph position and margins", _
45, 97, 0, "", ecCrimson, 0, True)
Call .Refresh 'Always end with "Refresh"
End With
End Sub