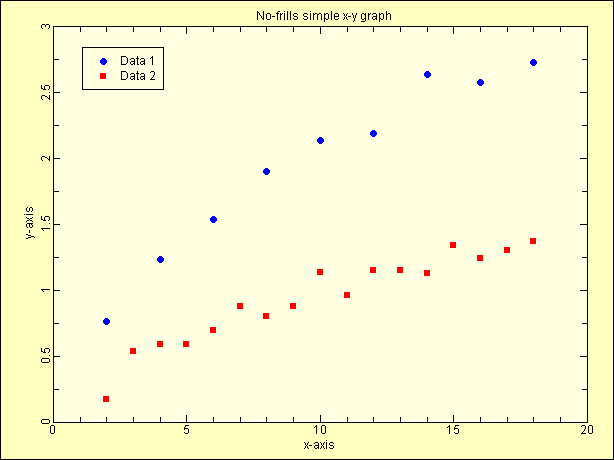
EcGraph Demo1. "No frills" simple x-y graph.
- This is about the simplest impementation of a graph with EcGraph.
- Scroll down below the screenshot image to see the VB code that was used to generate the graph.
The VB code used to generate the above graph...
Public Sub Demo1(EcGraph1 As EcGraph)
'"No frills" simple x-y graph
Dim i, X As Double, Y As Double
With EcGraph1
Call .Reset 'Always call "Reset" first to clear the page
'Start a new graph on the page..
Call .NewGraph("No-frills simple x-y graph")
'Start a new data set on the graph, and add random points..
Call .NewDataSet("Data 1")
For i = 1 To 9
X = 2 * i
Y = Sqr(i) - Rnd(i) / 3
Call .AddDataPoint(X, Y)
Next i
'Second data set for this graph
Call .NewDataSet("Data 2")
For i = 2 To 18
X = i: Y = Log(i) / 2 - Rnd / 4
Call .AddDataPoint(X, Y)
Next i
Call .Refresh 'Always end with "Refresh"
End With
End Sub