|
|
ecGraph Demo5. Stacked 3D Bar Graph, Text
labels.
- Stacked 3D Bar Graph, Text labels.
- Scroll down below the screenshot image to see the VB code that
was used to generate the graph.
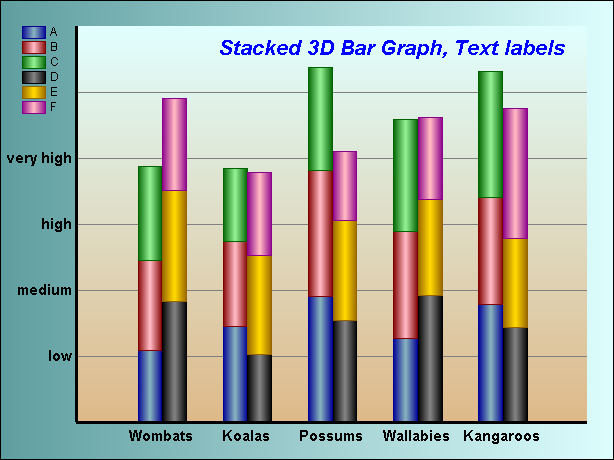
The VB code used to generate the above graph...
Public Sub Demo5(ecGraph1 As ecGraph)
'Stacked 3D Bar Graph, Text labels
Dim i, X As Double, Y As
Double
With ecGraph1
Call .Reset
'Always call "Reset" first to clear the
page
'Start a new graph on
the page..
Call .NewGraph("Stacked 3D
Bar Graph, Text labels")
Call .GraphTitleStyle(, "bold|16|italic", ecDarkBlue, 15, -10)
Call
.BorderStyle(ecCadetDarkBlue, ecLightCyan, 0, , , , 20, 7, -1, -1)
Call
.PlotAreaColors(ecBurlywood, ecLightCyan, 90)
Call
.LegendTableStyle(, , 2, 4, , 0, , , , , , True)
Call .AxisStyle(, 3)
Call
.AxisLabelStyle("bold||11|", , -3, 0)
Call
.AxisTitleStyle(, "bold|11|", , 0, False)
Call .AxisTickStyle(, , False, False,
False)
Call .AxisScaleStyle(0, 30, 6, 0, 2, ",Wombats,Koalas,Possums,Wallabies,Kangaroos")
Call
.SelectYaxis
Call .AxisStyle(, 3)
Call
.AxisLabelStyle("bold||11|", , -1, 0)
Call
.AxisTitleStyle(, "bold|11|", , -4, False)
Call .AxisScaleStyle(0, 12, 6, 0, 2, ",low,medium,high,very high")
Call
.AxisTickStyle(, , False, False, False)
Call
.AxisGridStyle(ecGray, , True, False)
'Start a new data set
on the graph, and add random points..
Call
.NewDataSet("A")
Call
.SymbolStyle(1, 7, 12431236, 9699328, 1, True, -3) '3D bar, width
5mm
For i = 1 To 5
X = 5 * i
Y = 2 + 2 * Rnd(i)
Call .AddDataPoint(X, Y)
Next i
'Start a new data set on the graph, and add random
points..
Call .NewDataSet("B")
Call .SymbolStyle(1, 7, ecLightPink, ecMaroon,
1, True, -3, , True) '2D bar, width
5mm
For i = 1 To 5
X = 5 * i
Y = 2 + 2 * Rnd(i)
Call .AddDataPoint(X, Y)
Next i
'Start a new data set on the graph, and add random
points..
Call .NewDataSet("C")
Call .SymbolStyle(1, 7, ecLightGreen,
ecDarkGreen, 1, True, -3, , True) '2D bar, width
5mm
For i = 1 To 5
X = 5 * i
Y = 2 + 2 * Rnd(i)
Call .AddDataPoint(X, Y)
Next i
'Start a new data set on the graph, and add random
points..
Call .NewDataSet("D")
Call .SymbolStyle(1, 7, ecGray, ecBlack, 1,
True, 3.5) '3D bar,
width 5mm
For i = 1 To 5
X = 5 * i
Y = 2 + 2 * Rnd(i)
Call .AddDataPoint(X, Y)
Next i
'Start a new data set on the graph, and add random
points..
Call .NewDataSet("E")
Call .SymbolStyle(1, 7, 55295, 26007, 1, True, 3.5, , True)
'2D bar, width 5mm
For i = 1
To 5
X = 5 * i
Y = 2 + 2 * Rnd(i)
Call .AddDataPoint(X, Y)
Next i
'Start a new data set on the graph, and add random
points..
Call .NewDataSet("F")
Call .SymbolStyle(1, 7, ecLightPink,
ecDarkMagenta, 1, True, 3.5, , True) '2D bar, width
5mm
For i = 1 To 5
X = 5 * i
Y = 2 + 2 * Rnd(i)
Call .AddDataPoint(X, Y)
Next i
Call .Refresh 'Always end
with "Refresh"
End With
End Sub
Copyright © 2007,
Encore Consulting Pty Ltd.
www.encoreconsulting.com.au
|