|
|
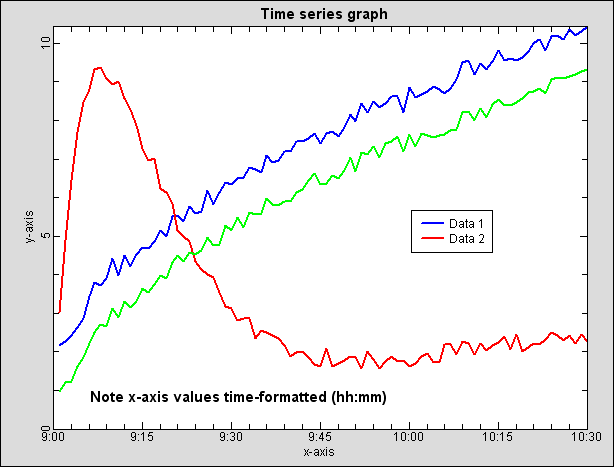
ecGraph Demo13. Time series graph, with axis values
as "hh:mm"
- Time series graph.
- Showing axes formatted as time using "hh:mm".
The VB code used to generate the above graph...
Public Sub Demo13(ecGraph1 As ecGraph)
'Time series graph
'In VB, [Date and Time] is stored as an 8-byte
number (like Double). The integer
'portion is the date, and the fraction portion is
the time as a fraction of 24 hours.
'Midnight is 0 and midday is 0.5; For dates, 0 is 30
Dec 1899.
'One hour is
t=1/24. One minute is t=1/24/60.
'So t=5/24=0.2083333 is 5:00AM, and
t=5/24+14/24/60=0.2180555 is 5:14AM.
Dim
i, t0 As Double, t1 As
Double, t As Double
Dim y1 As Double, y2 As
Double, y3 As Double
With ecGraph1
Call .Reset
'Always call "Reset" first to clear the
page
'Start a new graph
on the page..
Call .NewGraph("Time
series graph")
Call .PlotAreaColors(vbWhite) 'white plot area
i = 220: Call .BorderStyle(RGB(i, i, i)) 'light gray border area
Call
.LegendTableStyle(, , 67, 45, , , vbWhite, vbWhite)
Call
.GraphTitleStyle(, "11|bold") 'make the title a bit bigger
t0 = 9 / 24
'9:00AM
t1
= 10 / 24 '10:00AM
'Force the x-axis
to show 9AM to 10AM with 6 steps of 10 minutes
'Show the x-axis
labels as Hours:Minutes:Seconds, so that when zooming
'in you get the
seconds display.
'When ScaleStyle<>3 and TextLabels$<>"",
the format string will be used.
'You could also
use "mm:ss" for minutes and seconds only
Call
.AxisScaleStyle(t0, t1, 6, 5, 1, "h:mm")
'could also use "hh:mm:ss"
'Start three new data sets on the graph..
Call
.NewDataSet("Data 1"): Call .DataLine(, 2): Call .SymbolStyle(0)
Call
.NewDataSet("Data 2"): Call .SymbolStyle(0)
Call
.NewDataSet("Data 3"): Call .SymbolStyle(0)
Call
.AddText("Note x-axis values time-formatted
(hh:mm)", 7, 10, 0, "11|bold",
vbBlack, 0, True)
For i = 1 To 90
t = t0 + i / 24 / 60 'add one minute each loop
y1 = Sqr(i) - Rnd(i) / 2
y2 = y1 + 1 + Rnd / 3
y3 = 3 * i * Exp(-i / 8) + i
/ 40 + Rnd / 2
'Call .SetSelectedData(0)
Call .AddDataPoint(t, y1, 0, 0) 'add y1 to data set 1
'Call
.SetSelectedData(1)
Call .AddDataPoint(t, y2, 0, 1) 'add y2 to data set 2
'Call
.SetSelectedData(2)
Call .AddDataPoint(t, y3, 0, 2) 'add y3 to data set 3
Call .Refresh 'remove
this line for "instant draw"
Next i
Call
.Refresh 'Always end with "Refresh"
End With
End Sub
Copyright © 2007,
Encore Consulting Pty Ltd.
www.encoreconsulting.com.au
|